Bullish Candlestick Patterns PDF: Free Download 2024
In the world of trading, candlestick patterns hold immense significance, offering traders a wealth of valuable insights into market movements. The ancient Japanese techniques behind these formations are still very much relevant today, blending seamlessly with modern strategies to help both seasoned traders and novice investors. By exploring a comprehensive guide on these patterns, you can gain access to the tools that will elevate your trading game to new heights. The intricacies of bullish candlestick patterns are key in understanding price trends, and they unveil powerful applications for navigating the realm of financial markets. Whether you’re learning how these patterns can influence your decisions or looking to refine your skills, the interpretations and practical applications of these formations will help you better anticipate market movements, ultimately enhancing your understanding of how price action evolves. With the right knowledge, these techniques can take your trading strategy to the next level, giving you the edge you need to succeed.
What Are Bullish Candlestick Patterns?
Bullish candlestick patterns are specific chart formations that often indicate a potential reversal in the market, signaling a shift from a downtrend to an uptrend. These patterns emerge when buyers overpower sellers, causing an increase in price. By recognizing these patterns early on, traders can gain valuable insight into market psychology, which helps them spot potential entry signals. When used effectively, they allow traders to capitalize on rising price movements and potentially maximize their profits.
As a trader, understanding bullish candlestick patterns and how they reflect market sentiment is crucial. The power of these patterns lies in their ability to suggest market direction before it fully unfolds. Whether you’re looking at a PDF for quick reference or using these signals in real-time, recognizing and acting on them can dramatically improve trading decisions. When these patterns are used correctly, they offer a solid foundation for analyzing the ongoing price movements and taking advantage of the uptrend.
35 Powerful Candlestick Patterns
| Candlestick Pattern | Description | Additional Features |
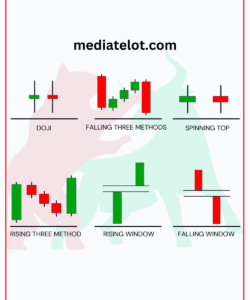
| Doji | Indicates market indecision and potential reversal. | Can appear in various shapes and sizes. Confirmation needed from subsequent price action. |
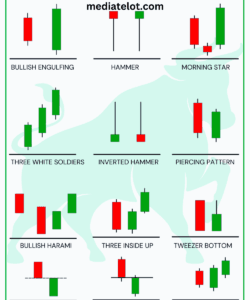
| Hammer | Bullish reversal signal with a long lower wick. | Requires confirmation from subsequent price action. Shadow should be at least twice the body. |
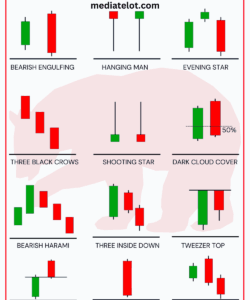
| Hanging Man | Bearish reversal signal at the peak of an uptrend. | Signals a potential trend reversal. Confirmation needed from subsequent candlesticks. |
| Shooting Star | Bearish reversal signal with a small body and long upper wick. | Indicates potential reversal in an uptrend. Confirmation needed from subsequent price action. |
| Inverted Hammer | Bullish reversal signal with a long upper wick and small body. | Typically appears at the bottom of a downtrend. Requires confirmation from subsequent candlesticks. |
| Bullish Engulfing | Bullish reversal pattern where the second candlestick completely engulfs the first. | Strong bullish signal when it appears at the end of a downtrend. Indicates a shift from selling to buying pressure. |
| Bearish Engulfing | Bearish reversal pattern opposite to bullish engulfing. | Strong bearish signal when it appears at the end of an uptrend. Indicates a shift from buying to selling pressure. |
| Piercing Line | Bullish reversal signal formed after a downtrend. | Second candlestick should close above the midpoint of the first candlestick. Indicates potential trend reversal. |
| Dark Cloud Cover | Bearish reversal signal formed after an uptrend. | Second candlestick should open above the previous candle’s high. Indicates potential trend reversal. |
| Morning Star | Bullish reversal pattern of three candles – a long bearish, a small-bodied, and a bullish candle. | Signals potential reversal from bearish to bullish. Requires confirmation from subsequent price action. |
| Evening Star | Bearish reversal pattern opposite to the Morning Star. | Signals potential reversal from bullish to bearish. Requires confirmation from subsequent candlesticks. |
| Three White Soldiers | Bullish reversal pattern formed by three consecutive long bullish candles. | Indicates strong buying pressure and potential trend reversal. Requires confirmation from subsequent price action. |
| Three Black Crows | Bearish reversal pattern opposite to Three White Soldiers. | Indicates strong selling pressure and potential trend reversal. Requires confirmation from subsequent candlesticks. |
| Bullish Harami | Bullish reversal pattern with a small candlestick inside a larger one. | Requires confirmation from subsequent candlesticks. Indicates a potential shift from bearish to bullish sentiment. |
| Bearish Harami | Bearish reversal pattern opposite to Bullish Harami. | Requires confirmation from subsequent candlesticks. Indicates a potential shift from bullish to bearish sentiment. |
| Bullish Belt Hold | Bullish signal with a long white candlestick that opens at or near the low and closes near the high. | Indicates strong buying pressure throughout the session. Typically occurs after a downtrend. |
| Bearish Belt Hold | Bearish signal opposite to Bullish Belt Hold. | Indicates strong selling pressure throughout the session. Typically occurs after an uptrend. |
| Marubozu | Bullish or bearish reversal pattern with a long body and little to no wicks. | Signifies strong buying or selling pressure depending on the color. Little to no wicks indicate dominance by buyers or sellers. |
| Tweezer Tops | Bearish reversal pattern with two candlesticks at the peak of an uptrend. | Indicates potential exhaustion of buying pressure. Requires confirmation from subsequent candlesticks. |
| Tweezer Bottoms | Bullish reversal pattern opposite to Tweezer Tops. | Indicates potential exhaustion of selling pressure. Requires confirmation from subsequent candlesticks. |
| Bearish Abandoned Baby | Bearish reversal pattern with a gap down after a Doji. | Requires confirmation from subsequent candlesticks. Indicates a potential reversal in an uptrend. |
| Bullish Abandoned Baby | Bullish reversal pattern opposite to Bearish Abandoned Baby. | Requires confirmation from subsequent candlesticks. Indicates a potential reversal in a downtrend. |
| Upside Tasuki Gap | Bullish continuation pattern with a gap up followed by two inside days. | Indicates potential continuation of an uptrend. Second day’s close should be above the first day’s close. |
| Downside Tasuki Gap | Bearish continuation pattern opposite to Upside Tasuki Gap. | Indicates potential continuation of a downtrend. Second day’s close should be below the first day’s close. |
| Kicking | Bullish or bearish reversal pattern with one candlestick completely engulfing the prior candlestick. | Strong signal when the prior candlestick is completely engulfed. Indicates a decisive shift in market sentiment. |
| Gravestone Doji | Bearish reversal pattern with a long upper wick and no lower wick. | Indicates potential reversal in an uptrend. Requires confirmation from subsequent candlesticks. |
| Dragonfly Doji | Bullish reversal pattern with a long lower wick and no upper wick. | Indicates potential reversal in a downtrend. Requires confirmation from subsequent candlesticks. |
| Long-Legged Doji | Indicates market indecision with long upper and lower wicks. | Indicates uncertainty in the market. Requires confirmation from subsequent price action. |
| Spinning Top | Indicates market indecision with small body and long upper and lower wicks. | Suggests a battle between buyers and sellers. Requires confirmation from subsequent candlesticks. |
| Rickshaw Man | Indicates market indecision with a small body and long wicks. | Signifies uncertainty in the market. Requires confirmation from subsequent candlesticks. |
| Harami Cross | Bullish or bearish reversal pattern with a small candlestick inside a larger one, indicating uncertainty. | Requires confirmation from subsequent candlesticks. Indicates potential reversal depending on the direction of the subsequent candlestick. |
| Meeting Lines | Bullish or bearish continuation pattern with two candlesticks of opposite colors having the same close. | Indicates potential continuation of the current trend. Requires confirmation from subsequent candlesticks. |
| Separating Lines | Bullish or bearish continuation pattern with two candlesticks of the same color and different closes. | Suggests a continuation of the prevailing trend. Needs confirmation from subsequent candlesticks. |
| Mat Hold | Bullish continuation pattern where a long white candle is followed by a series of small-bodied candles. | Indicates continuation of an uptrend. Traders often look for this pattern to confirm strong buying momentum. |
Download 35 powerful candlestick patterns pdf
Factors Influencing Bullish Patterns
When analyzing bullish patterns, several factors play a significant role in determining their reliability. First, the timeframe in which the pattern forms is essential. Patterns on daily or weekly charts tend to be more significant, with longer timeframes offering greater reliability. In contrast, patterns on hourly charts can be less dependable, and may not indicate the same strength of a trend. The volume is another key element in assessing the strength behind a bullish pattern. Higher volume during the formation of a bullish candle not only supports the pattern but also strengthens the signal, making it more likely to succeed. Finally, identifying support and resistance levels is crucial. When a bullish pattern forms near a strong support level, the success rate increases, enhancing the overall effectiveness of the pattern. By combining these elements—timeframe, volume, and support levels—traders can better gauge the potential of a bullish pattern in their strategies.
Combining Candlestick Patterns with Indicators
When using bullish candlestick patterns in trading, the effectiveness of your strategy can be greatly improved by incorporating technical indicators such as moving averages, RSI, and volume analysis. These indicators provide critical confirmation that can strengthen your analysis and increase the likelihood of making successful trades. For instance, when a bullish candlestick forms, checking its alignment with a moving average can offer valuable insight into the overall market trend. If the trend is bullish, as indicated by the moving averages, the trade is likely to be more fruitful.
Moreover, combining the RSI with bullish candlestick patterns can help you gauge whether the asset is oversold or in an uptrend, further confirming the candlestick signal. Likewise, volume analysis can provide additional confirmation, ensuring that the trade has strong market participation, which enhances its probability of success. By understanding how these indicators interact with bullish patterns, you can fine-tune your strategy and boost the effectiveness of your trading decisions.
Also Read : Toronto Stock Option CPA
Trading Strategies Using Bullish Patterns
When applying bullish patterns in trading, it’s crucial to choose between short-term and long-term strategies. In short-term trading, patterns like the Hammer are often used by day traders to capture quick price movements. These traders rely on quick setups and exits, aiming to profit from small fluctuations in the market. On the other hand, long-term investing tends to focus on stronger, more reliable patterns such as the Three White Soldiers, which signal a strong upward trend over a longer period.
Regardless of whether you’re trading short-term or investing long-term, traders should always consider risk management. This involves setting stop-loss orders just below key support levels, ensuring that potential losses are controlled. Additionally, utilizing trailing stops can help you lock in profits as the price moves in your favor, allowing you to ride the trend without missing out on potential gains.
Conclusion
When it comes to bullish candlestick patterns, mastering the skill to identify these formations is essential for any trader or long-term investor. These patterns offer a reliable signal for identifying potential upward market movements, and can be incredibly valuable when used in combination with other technical analysis tools. Whether you’re a day trader looking to capitalize on short-term price changes or a long-term investor aiming to position yourself for sustained growth, understanding these patterns is vital. However, it’s important to remember that no pattern is ever foolproof. A disciplined approach to risk management is just as critical. Even with the best signals, risk management ensures that you’re protected in case the market moves against you.
For more insightful articles please visit mediatelot.com
As you deepen your understanding of bullish candlestick patterns, always remember that these formations are part of a larger puzzle. The combination of careful analysis, market trends, and risk management strategies will help you make more informed decisions. While these patterns can indeed serve as strong indicators of upward market momentum, their effectiveness is amplified when used alongside other technical tools. This comprehensive approach allows both day traders and long-term investors to spot opportunities with greater precision, while minimizing the potential for losses in volatile conditions. Always approach trading with a balanced mindset—recognize the patterns, but remain vigilant with your strategy and risk management.